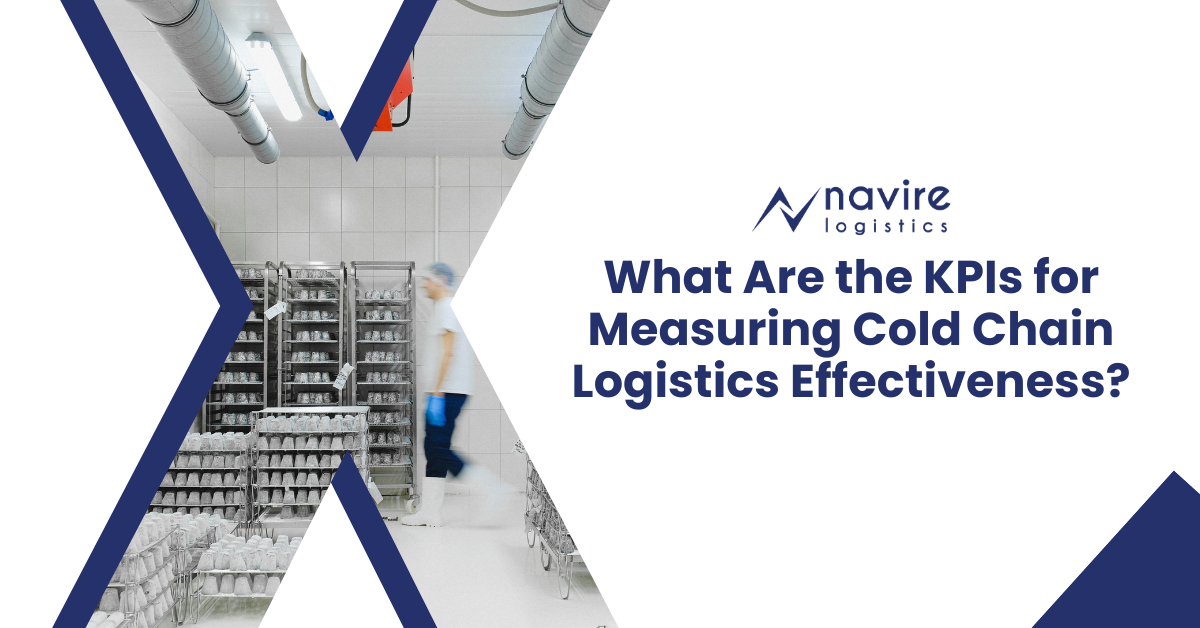
Hey there! If you’re involved in cold chain logistics, you already know how critical it is to maintain temperature-sensitive goods such as vaccines, fresh produce, or pharmaceuticals. But how do you know if your logistics operation is working as it should? That’s where KPIs (Key Performance Indicators) come in.
KPIs for measuring cold chain logistics effectiveness are the backbone of understanding your processes’ performance. They help you identify what’s working and what’s not so you can make adjustments to improve overall efficiency, reduce costs, and deliver better customer results.
In this post, we’ll break down the most important KPIs you need to track, from On-Time Delivery Rate to Perfect Order Delivery Rate, and show you exactly why each one matters. Let’s dive in!
Why KPIs Matter in Cold Chain Logistics
Tracking KPIs isn’t just about numbers. It’s about making informed decisions. If you’re not measuring, how do you know what’s going on behind the scenes? For example, if you deliver fresh food or life-saving medicine, even the smallest delay or temperature deviation could be catastrophic.
So, when we talk about KPIs for measuring cold chain logistics effectiveness, think of them as your navigation system in a sea of data. These KPIs guide you to optimal performance and, most importantly, ensure that the products you’re transporting are safe and on time.
Regularly analysing these metrics can refine your operations, keep costs down, and protect your reputation as a reliable logistics provider. Let’s break down these KPIs, shall we?
Top KPIs for Measuring Cold Chain Logistics Effectiveness
On Time Delivery Rate
Let’s start with one of the most important KPIs in cold chain logistics: on time delivery rate. It’s as simple as it sounds: how often do you get your products to the right place at the right time?
Delays can have serious consequences in cold chain logistics. A missed delivery window could mean spoiled goods, legal fines, and unhappy customers. Tracking this KPI is essential because it shows you exactly how reliable your supply chain is.
How to Improve On Time Delivery
i. Optimize route planning to avoid delays.
ii. Use mean-time tracking to monitor shipments.
iii. Partner with reliable carriers and logistics providers like Navire Logistics.
Focusing on this KPI can enhance customer satisfaction and build a reputation for reliability.
How to Calculate On Time Delivery Rate
Formula:
On Time Delivery Rate = Number of On-Time DeliveriesTotal Number of Deliveries × 100
For example, if you made 100 deliveries in a week, and 90 were on time, your on-time delivery rate would be:
90100 × 100 = 90%
A higher percentage means you’re getting products delivered when promised, keeping customers happy and reducing waste.
Pro Tip: If you’re consistently falling short, you may need to evaluate your transportation routes, warehouse management, or even partner with a more reliable courier service.
Temperature Compliance
Next up is temperature-compliance. If you’re transporting products like vaccines or fresh produce, you already know that the temperature must be right throughout the journey. A small deviation can spoil the product, and you don’t want to take that risk.
Temperature-compliance is a non-negotiable KPI. It ensures that your products stay within the required temperature range throughout the supply chain process.
How to Achieve Temperature-Compliance
i. Invest in advanced refrigeration systems.
ii. Use IoT-enabled sensors for mean-time temperature monitoring.
iii. Train staff on proper handling procedures.
Navire Logistics leverages cutting-edge technology to ensure temperature-compliance, safeguarding your products from spoilage or damage.
How to Calculate Temperature-Compliance
Formula:
Temperature-Compliance Rate= Number of Deliveries within Temperature RangeTotal Number of Deliveries × 100
You made 200 deliveries, and 190 were within the required temperature range. Your temperature-compliance rate would be:
190200 × 100 = 95%
If you’re hitting less than 95%, it’s time to look into your refrigeration systems, temperature sensors, or how goods are handled during transit.
Vehicle Dwell Time
This is where things get interesting. Vehicle dwell time refers to how long your vehicles are stuck at a location, such as a warehouse, port, or distribution centre, before heading out again. If your trucks are sitting idle for too long, that’s time and money wasted.
Lower dwell time means your trucks are more efficient, getting the products to their destinations faster. But how do you measure it?
Strategies to Reduce Dwell Time
i. Simplify loading and unloading processes.
ii. Schedule appointments for deliveries to avoid congestion.
iii. Use automated systems to speed up operations.
You can improve efficiency and ensure timely deliveries by reducing vehicle dwell time.
How to Calculate Vehicle Dwell Time
Formula:
Average Dwell Time Total Time Spent at LocationsTotal Number of Deliveries
For instance, if a truck spends a total of 12 hours waiting across six stops, the average dwell time would be:
126= 2 hours per stop
Shorter dwell times mean faster turnarounds, translating into more deliveries in less time and less Fuel used.
Pro Tip: You can cut dwell time by optimizing scheduling, improving warehouse processes, and using automation where possible.
Fuel Efficiency
Fuel is one of the biggest expenses in logistics. Fuel efficiency isn’t just about saving money; it’s also about reducing one’s environmental footprint. By improving fuel efficacy, one can cut operational costs and emissions.
Tips to Improve Fuel Efficacy
i. Maintain vehicles regularly to ensure optimal performance.
ii. Use fuel-efficient routes and avoid traffic congestion.
iii. Invest in hybrid or electric refrigerated vehicles.
Navire Logistics is committed to sustainability, helping you achieve fuel efficiency while reducing your carbon footprint.
How to Calculate Fuel-Efficiency
Formula:
Fuel Efficiency = Distance Traveled (miles or km)Fuel Consumed (gallons or liters)
If a truck covers 300 miles and uses 50 gallons of Fuel, the fuel efficiency would be:
30050 = 6 miles per gallon (mpg)
Improving fuel efficacy reduces costs and improves the sustainability of your cold chain operations, which is becoming increasingly important to consumers and regulatory bodies alike.
Perfect Order Delivery Rate
What matters most is the perfect order delivery rate. This KPI measures how often you deliver an order without any issues on time, at the correct temperature, with the right items, and in the right condition.
How to Achieve a High Perfect Order Delivery Rate
i. Ensure accurate order processing and fulfilment.
ii. Maintain strict quality control throughout the supply chain.
iii. Use advanced tracking and monitoring systems.
At Navire Logistics, we pride ourselves on delivering perfect orders and ensuring your customers receive their products in pristine condition.
How to Calculate Perfect Order Delivery Rate
Formula:
Perfect Order Delivery Rate = Number of Perfect OrdersTotal Orders × 100
For example, if you completed 500 orders in a month and 480 of them were perfect, your perfect order delivery rate would be:
480500 × 100 = 96%
The higher the rate, the more efficient and customer-friendly your cold chain operations are.
Vehicle Utilization Rate: Maximizing Resource Efficiency
Understanding Vehicle Utilization Rate
The vehicle utilization rate measures how effectively your fleet is being used. A low utilization rate indicates inefficiency, while a high rate ensures your resources are used to their full potential.
How to Optimize Vehicle Utilization
i. Consolidate shipments to maximize load capacity.
ii. Use route optimization software to plan efficient trips.
iii. Monitor and adjust fleet size based on demand.
You can reduce costs and enhance operational efficiency by improving vehicle utilization rates.
Inventory Days of Supply: Balancing Supply and Demand
What Are Inventory Days of Supply?
Inventory days of supply measures the number of days your inventory can cover customer demand. In cold chain logistics, maintaining the right balance is crucial to avoid overstocking or stockouts.
Strategies to Optimize Inventory Days of Supply
i. Use demand forecasting tools to predict customer needs.
ii. Implement just-in-time inventory practices.
iii. Partner with a logistics provider like Navire Logistics to ensure timely replenishment.
This KPI helps you maintain optimal inventory levels, reducing waste and ensuring product availability.
Enhance Your Cold Chain Logistics with Navire Logistics
Tracking KPIs for calculating cold chain logistics effectiveness is crucial for keeping your operations smooth, cost-efficient, and customer-centric. By focusing on metrics like on time delivery rate, temperature-compliance, and vehicle dwell time, you can improve every part of your cold chain process, from transportation to delivery.
Remember, these KPIs are more than just numbers. They’re powerful tools that provide valuable insights into your logistics performance. Regularly tracking and analysing these metrics ensures your cold chain logistics operations run at peak efficiency, delivering on customer expectations and driving long-term success.